Extracting Structured Datasets for Systematic Strategies from Unstructured Textual Sources: Brain Alternative Datasets
Wed Jul 10 2024 by Francesco Cricchio and Matteo CampelloneNatural Language Processing (NLP) is a broad field that enables computers to process and analyze unstructured textual data. In this article, we present several proprietary Brain datasets derived from news articles, SEC regulatory filings, and earnings calls, along with case studies implemented in QuantRocket.
1. Introduction
In recent years, active investors have continuously sought additional sources of information on financial markets. Consequently, the number of alternative data providers and platforms that aggregate and integrate alternative data for asset managers has steadily increased, creating a large and diverse ecosystem.
The term "alternative data" has broadened to include a variety of sources, such as satellite imagery, credit card transactions, weather data, social media, news, and corporate documents. Essentially, alternative data encompasses all data that falls outside the realm of traditional financial and economic data, yet holds potential value for investment strategies.
A significant portion of the available alternative data is derived from textual documents using Natural Language Processing (NLP) tools, a rapidly advancing field. This document offers a general overview of Brain's approaches to creating alternative datasets based on various language metrics applied to textual documents, including news articles, SEC filings, and earnings call transcripts.
2. Sources of Textual Information
Newsflow Collection: Public news is a significant source of information. According to the efficient market hypothesis (EMH), public news should not be a useful trading source since its content is quickly reflected in market prices. However, EMH has been challenged since the 1980s, with studies highlighting inconsistencies between EMH and observed data. Recent research suggests these inconsistencies can be interpreted through order flow dynamics. Thus, changes in news flow may impact market trades and prices. Analyzing the correlation between sentiment changes in news and market performance is widely studied. Assessing the sentiment of news flow on individual assets by measuring aggregated sentiment, news volume, and related metrics can be valuable.
SEC Filings: Form 10-Ks and 10-Qs: Form 10-K (annual) and Form 10-Q (quarterly) filings required by the SEC are valuable information sources. These documents provide detailed information about a company's history, performance, and potential risks. Despite their public accessibility, studies suggest market inefficiencies in capturing the information due to increased complexity and length. Analysis of the past decade's 10-K filings shows trends of increasing document length, higher readability scores (indicating increased difficulty), and longer sentences.
Earnings Calls Transcripts: Earnings calls, where top executives present quarterly or annual results and future outlooks to analysts, media, and investors, are another vital information source. The last part of the call includes a Q&A session addressing specific relevant topics. Earnings calls are structured similarly for global stocks, unlike 10-K and 10-Q filings, which are US-specific. Studies highlight the value of earnings call content for investors. Various providers offer access to earnings call transcripts, using manual, software-assisted, or hybrid transcription processes, with availability ranging from minutes to hours after the event.
3. Structured Datasets from Unstructured Sources
Unlike "structured data," which is organized, typically quantitative, and easily processed by a computer, a vast amount of information is available in an unstructured form. This unstructured data is generally in its native form, not organized or easily processed by a computer. The textual documentation we discuss, such as news, corporate documents, and transcripts, falls into this second category. Natural Language Processing (NLP) is a broad field that enables computers to process and analyze textual data.
3.1 Measuring Sentiment and Attention in Corporate Newsflow
Measuring sentiment in texts is a common activity nowadays with applications ranging from assessing marketing and political campaigns to monitoring news and corporate documents. Many providers calculate sentiment for listed companies based on various sources like news, social media, and documents.
There is no single "sentiment" algorithm; each measure depends on assumptions and specific methodological choices, from the sources used to the parsing approach and aggregation phase.
Here, we present an overview of the process used to calculate the "Brain Sentiment Indicator" (BSI) and discuss some specific methodological choices.
The BSI algorithm is based on a simple approach that prioritizes simplicity and explicability. It uses a combination of semantic rules for financial news classification and a dictionary-based approach (Bag of Words - BOW). Sentiment is calculated from news headlines, which typically summarize the overall meaning of the text while limiting the noise from longer texts.
When calculating metrics related to news volume, one must consider that average news volume depends on the specific company. A normalized measure of volume, often called "buzz," can be useful. "Buzz" is defined as the difference between current news volume and the past volume average in units of standard deviations. A value close to 0 indicates no significant media attention compared to the average, while a value significantly larger than 0 highlights increased media attention. An high buzz in combination with negative sentiment typically highlights very negative events in a company.
3.2 Use case study based on Brain Sentiment Indicator
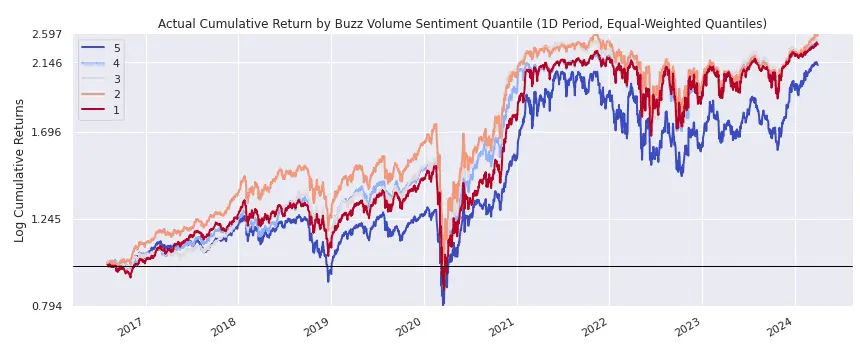
In this use case, we explore the impact of news buzz over a short time horizon — specifically, the previous day — on stock forward returns by conducting a quintile backtest using Pipeline and Alphalens.
from zipline.pipeline import Pipeline, brain
from zipline.pipeline.factors import AverageDollarVolume

avg_dollar_volume = AverageDollarVolume(window_length=90)

buzz_volume_sentiment =  brain.BSI.slice(1).BUZZ_VOLUME_SENTIMENT.latest

pipeline = Pipeline(
    columns={
        "buzz_volume_sentiment": buzz_volume_sentiment,
    },
    screen=(
        avg_dollar_volume.top(1000)
        & buzz_volume_sentiment.notnull()
    )
)
By analyzing the buzz field over a 1-day horizon, we observed that stocks with the lowest buzz (quintile 1) on the previous day tend to outperform those with the highest buzz (quintile 5). This behavior could be explained by the idea that an anomalously high number of news articles (high buzz) published in the short term (the previous day) typically corresponds to bad news. Conversely, if the number of news articles is similar to the past average (low buzz), it indicates that the business is performing as usual.
3.3 Measures on Corporate Documents
Recent literature highlights interesting inefficiencies in the market's response to company filings due to the increased complexity and length of these reports (see, for example, "Lazy Prices" by Cohen et al., 2018, and "The Positive Similarity of Company Filings and the Cross-Section of Stock Returns" by M. Padysak, 2020).
One main idea presented in "Lazy Prices" is that authors of company filings tend to retain much of the structure and content in their newest filings when the underlying business is strong and growing. Conversely, when the business exhibits weakness, the author needs to provide more explanations, often resulting in textual amendments and additions.
To systematically exploit the information available in 10-K and 10-Q reports, one can sort reports using similarity metrics compared to the previous year's report for the same period. Additionally, measuring various language characteristics, such as sentiment, the number of positive/negative words, or the prevalence of specific language styles (e.g., "litigious," "constraining"), can provide insights. Other language characteristics, like readability scores or lexical richness, can also be informative.
These measures can be used either in absolute terms or by examining changes compared to previous reports. For example, one could analyze differences in language styles and systematically go long or short on stocks based on these metrics, such as avoiding stocks with an increase in litigious language.
To reduce noise and focus on text dense with relevant information, metrics can also be calculated on specific sections, such as the "Management's Discussion and Analysis of Financial Condition and Results of Operations" (MD&A) or "Risk Factors" sections.
3.4 Use case study based on measures on corporate documents
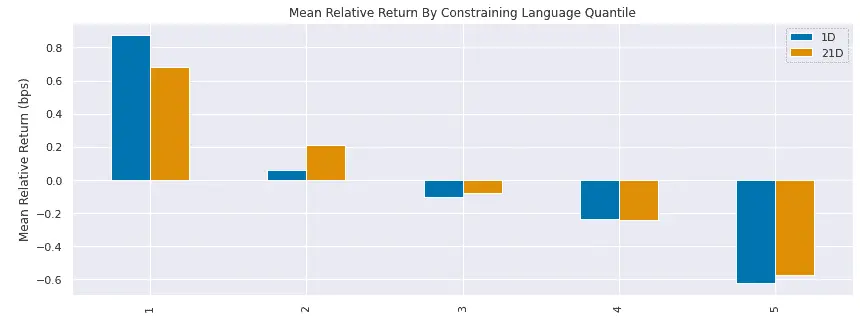
In this use case, we explore the impact of metrics related to the amount of constraining language present in the latest 10-K report.
avg_dollar_volume = AverageDollarVolume(window_length=90)

constraining_language =  brain.BLMCF.slice("10-K").SCORE_CONSTRAINING.latest

pipeline = Pipeline(
    columns={
        "constraining_language": constraining_language,
    },
    screen=(
        avg_dollar_volume.top(1000)
        & constraining_language.notnull()
    )
)
A quintile backtest performed using Alphalens shows that the bottom quintile (quintile 1), representing reports with the least constraining language, outperforms those with the most constraining language (quintile 5).
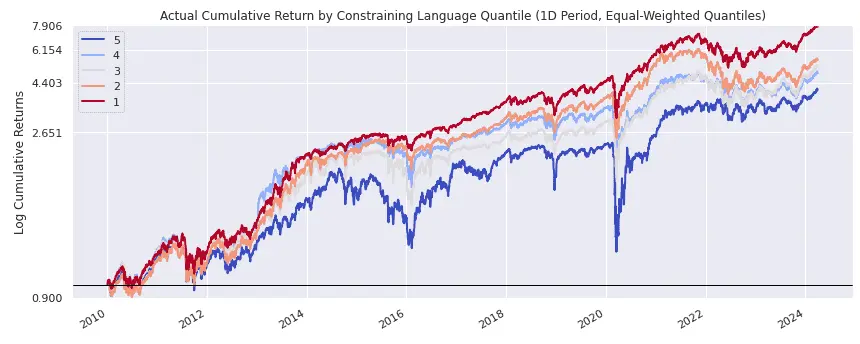
Furthermore, the five quintiles exhibit a clear, ordered performance that aligns with their ranking.
3.5 Measures on Earnings Calls Transcripts
The same analyses and metrics used for company filings (Section 3.2) can also be applied to Earnings Calls Transcripts (ECT). ECTs are rich in relevant information regarding a company's performance, outlook, and potential risks. Unlike SEC forms, which are primarily regulatory and often emphasize risks and threats, ECTs provide a more balanced discussion of results, business opportunities, and risks due to their more discursive nature.
For ECTs, distinguishing between changers and non-changers may be less relevant than other systematic patterns or investment ideas, which could involve the relative "sign" of the differences or the absolute values of certain features.
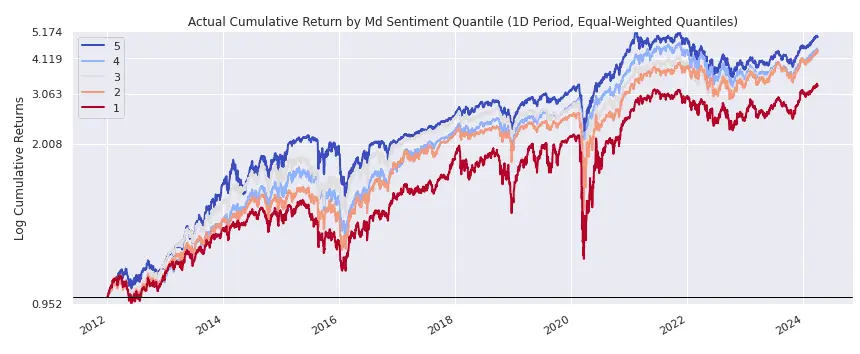
3.6 Use case study based on measures on earnings calls transcripts
By sorting stocks based on the sentiment expressed in the management discussion section of their last earnings call, we discovered that stocks with higher sentiment tend to outperform those with lower sentiment, though the effect is not very large and not persistent in all subintervals. This finding is illustrated in the following use case, which utilizes the Alphalens package.
4. Final Remarks
We have presented various approaches to extracting information from textual sources such as news articles, SEC regulatory filings, and earnings calls, transforming this information into usable structured datasets. In particular, we discussed several proprietary Brain datasets based on these sources, along with case studies implemented within the QuantRocket platform.
About QuantRocket
QuantRocket is a Python-based platform for researching, backtesting, and trading quantitative strategies. It provides a JupyterLab environment, offers a suite of data integrations, and supports multiple backtesters: Zipline, the open-source backtester that originally powered Quantopian; Alphalens, an alpha factor analysis library; Moonshot, a vectorized backtester based on pandas; and MoonshotML, a walk-forward machine learning backtester. Built on Docker, QuantRocket can be deployed locally or to the cloud and has an open architecture that is flexible and extensible.
Learn more or install QuantRocket now to get started.
About Brain
Brain is a research-focused company that develops proprietary signals based on alternative data and algorithms for investment strategies on financial markets.
The Brain team combines extensive experience on financial markets with strong competencies in Statistics, Machine Learning and Natural Language Processing.
Explore this research on your own
This research was created with QuantRocket. Clone the brain-sentiment repository to get the code and perform your own analysis.
quantrocket codeload clone 'brain-sentiment' Send a Message